How can you tell the processing times and true path of network frames within the ESXi host? Traceflow is the tool in NSX-T Data Center that is most commonly thought of for providing the insight into the traffic. But for a deeper dive, there is another tool. It is a switch while using pktcap-uw that shows detailed description of the process within the host’s memory. The switch is –trace. Check this out:

The first command [nsxcli -c get ports] gathers the necessary information from the host. This little shortcut to run an nsxcli command without invoking the entire CLI may have just made it worth your while on perusing this post! The PortNum gathered with that command is THE object to reference for all the tracing to be accomplished.
The next command [pktcap-uw –switchport 6718909 –proto 0x01 –trace] is the magic! Obviously we are identifying the source PortNum with the –switchport parameter, followed by a filter to only look at ICMP traffic. The switch –trace turns on the tracing capability running through the kernel.
The first packet captured shows the IOChain from the injection of the frame starting at the vNIC, to the switchport, into the IOChain starting with the DVFilter (not in existence in this capture, since the VM is attached to a dVPg, NOT an NSX Port Group.) The timestamps provide a thorough story following the frame all the way to the UplinkSndKernel before the frame is released from memory. The UplinkSndKernel forwards the frame to the Physical switch from the pNIC.
The next packet begins being captured at the UplinkRcvKernel port. The frame can then be traced through the kernel until it arrives at the vNIC of the destination VM, when it is released from memory once delivered.
Look at those timestamps. From vNIC to pNIC took 47 microseconds. Arriving from pNIC to vNIC, 26 microseconds. Just glad I don’t have to click a stopwatch to gather this timing! Only 112 microseconds to process through my L3 Physical VLAN interfaces. Total RTT less than .2 ms. Pretty cool to be able to see this, right?
DFW impact
Now for another discovery that wasn’t as pleasant an outcome for me, as a advocate of the Distribute Firewall in NSX-T. I always new there was some overhead in processing dvfilter rules, but the trace showed a little more impact than I was expecting. Let me show you. I’ve removed many of the IOChain entries that you saw in the previous result in the one that follows, focusing on the impactful entries.
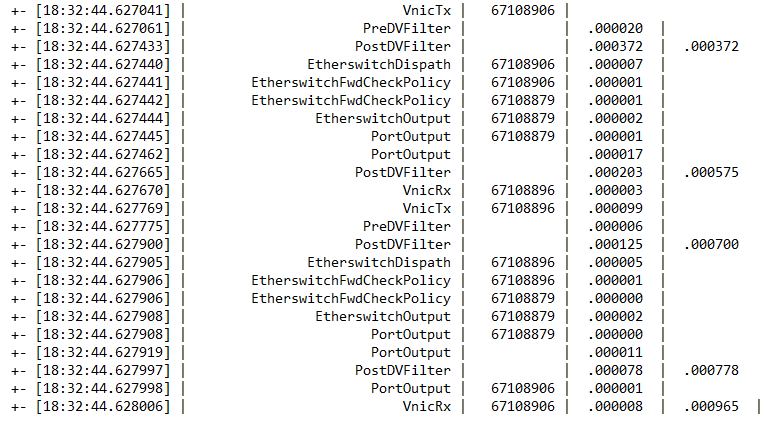
The source VM was attached to a logical switch (segment) with PortNum 6718906. 67108879 is one of my favorite switchports, the vdrport. PortNum 67108896 was the destination VM attached to another segment replying to the echo request. The second column from the right lists the delta times for each step. The last column is an accumulation of DVFilter (four hits), with the last number representing the total RTT. As you can see, instead of less than 200 microseconds as the previous example showed, we are nearing a millisecond with this trace. The majority of time was in the PostDVFilter column. (778 microseconds of the total time of 965.) The 187 microsecond difference is represents the data path from vnic-segment-Tier1-Tier0-Tier1-segment-vnic all taking place within the memory of this host.
While this test is certainly not a definitive study of the overall effects the Distributed Firewall has introducing a little latency into the data path, it is the first time that I’ve seen a tool that can assist in evaluating this factor. By the way, when the DFW blocks traffic, it happens extremely fast. The following trace shows the total time when a ping attempt is being rejected by the DFW, including the reject notification, is under 100 microseconds.
The rule in question on the dvfilter for switchport 67108906 was processed as Rule number 14, a reject rule for icmp. 55 microseconds to figure that one out! As you’ve all heard me say in the past, “YOU SHALL NOT PASS!” Good job DFW!
This tracing tool can be of great assistance in your troubleshooting the networking within an ESXi host. Let me know how you’ve put it to use.
Thanks for reading.

this is great, thanks for taking the time to put this together
LikeLike