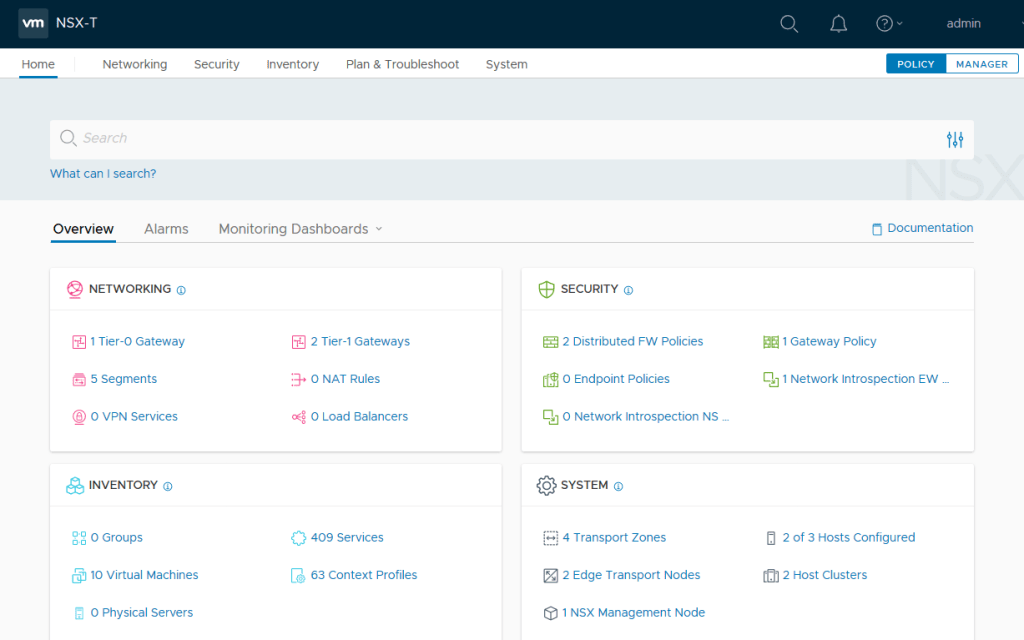
Isn’t it pretty? Hmm. Do you think so? It is streamlined quite a bit. You might first notice that there is no longer a tab for “Advanced Networking and Security.” Personally, I always wondered about that title in any case. I mean, the “Advanced Networking and Security” included the UI from the previous versions of NSX-T which used an earlier API, called the Manager API, while what we labeled the “Simple” or “Simplified” UI used an API referred to as the Policy API. It is important to be aware that these two APIs are somewhat separate. Objects created by the Manager API, for example, do not appear in what we called the Simple UI managed by the Policy API. Conversely, objects created by the Policy API can be seen in the “Advanced Networking and Security,” but are “protected” objects which in many cases can not be edited through the Manager API. Now what is available is called the NSX API. That’s easier to say and remember!
If that doesn’t get your motor running, take a peak at the new “Network Topology” view available in NSX-T 3.0. Each Tier-0 Gateway, Each Tier-1 Gateway, Each Segment and an expandable listing of workloads connected to each segment. There are many times a picture is worth a thousand words, so I’ll stop writing words and show you a couple pictures:
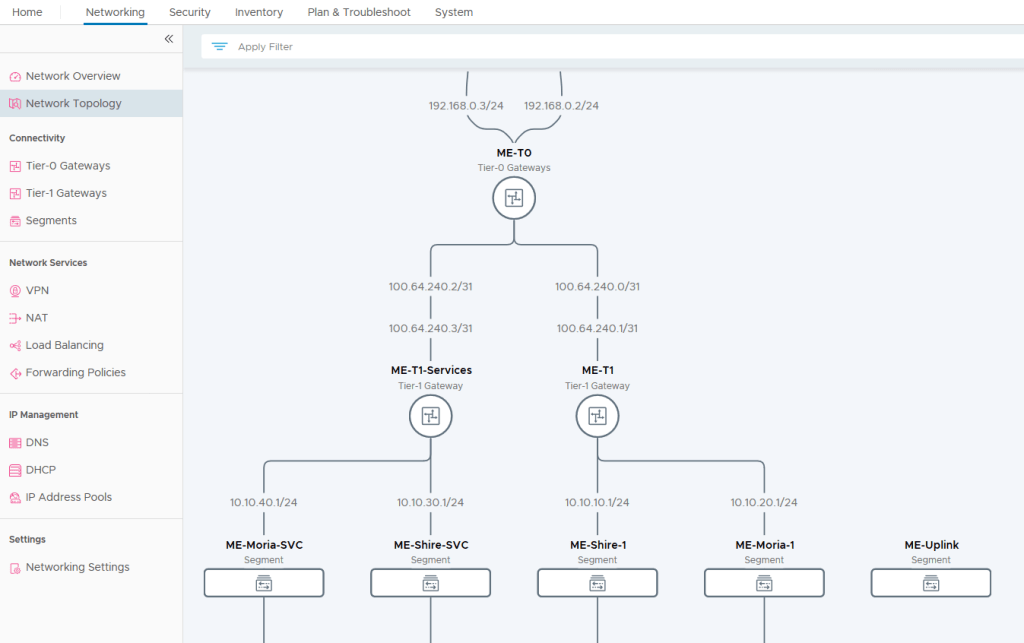
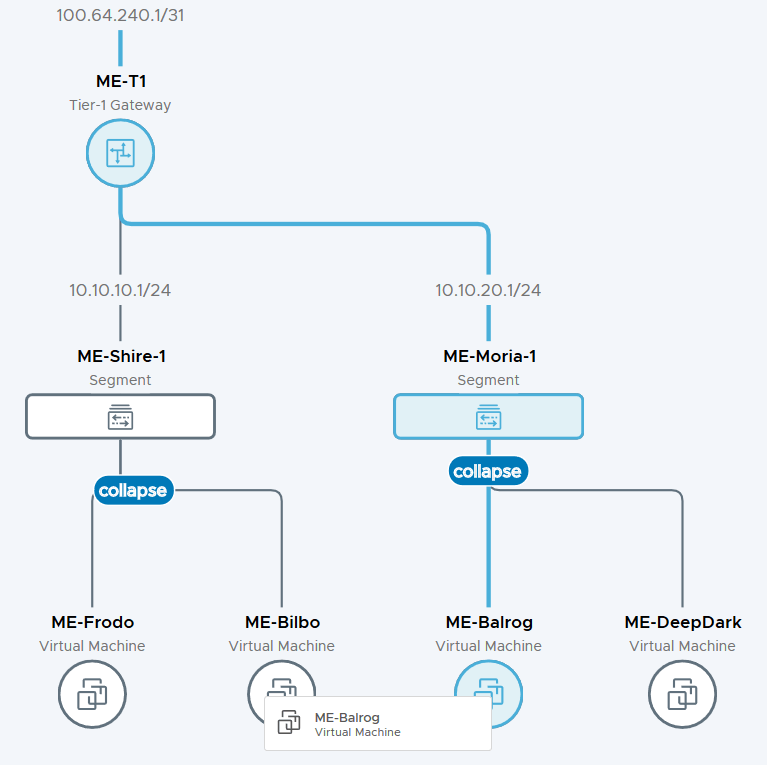
So that is a new way to view your network topology helping to clarify in your mind how the segments interact with the gateways and so forth. Labels and popup information define object types and names. Cool, huh?
Another newly added feature is the ability to assign time periods to distributed firewall policies. This feature has been requested for a long time, and, as the saying goes, “ask and you shall receive…” 😉
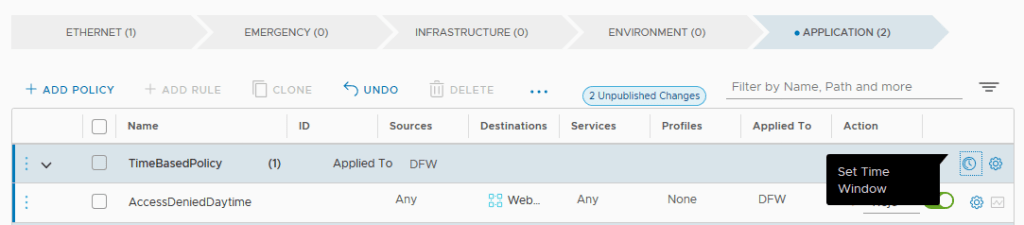
Here you see the firewall interface with a policy that can be configured with a time window. A couple points to make here. First the policy contains the rules and each of the rules within the policy will be applied during the time window for the policy. In other words, one time window per policy and all rules within are affected. Second point is that there is no “clock” icon per rule, so see the first point. All the rules in the policy…
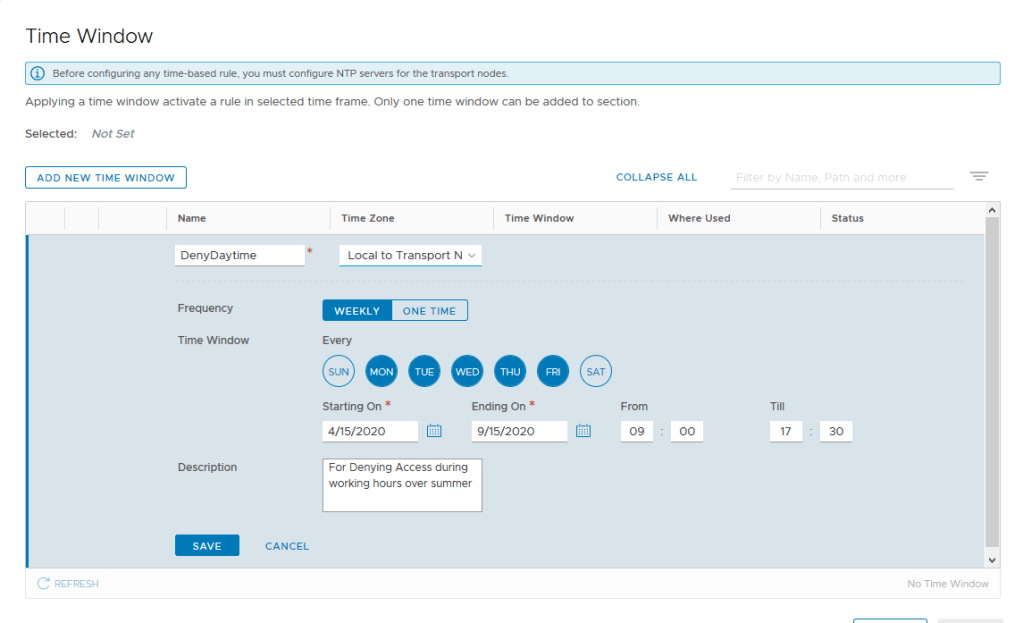
One further note on the time-based rules. You have to synchronize your clocks. OK, you’ve probably already done that, but it doesn’t hurt to double check your ntp settings on the transport nodes.
There is so much to talk about in this release, but I’ll finish with this last addition. It’s the Distributed Intrusion Detection System that has been added to further analyze, at the hypervisor level, potential threats as identified by specific CVE entries. Nice. Let’s take a look at the UI.
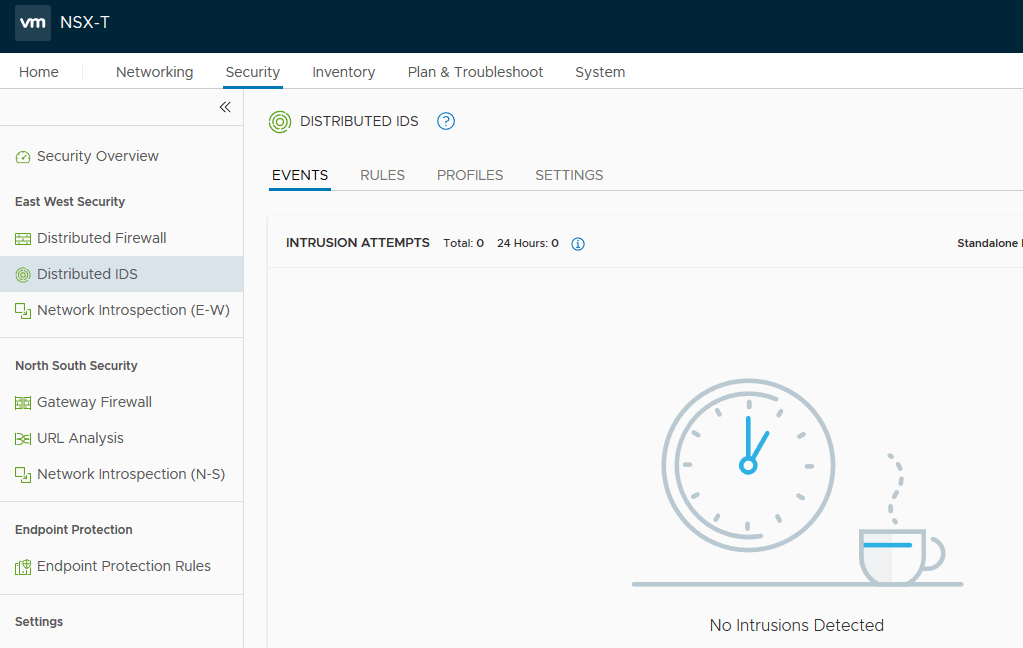
All righty then. No Intrusions Detected. What did we check anyway?
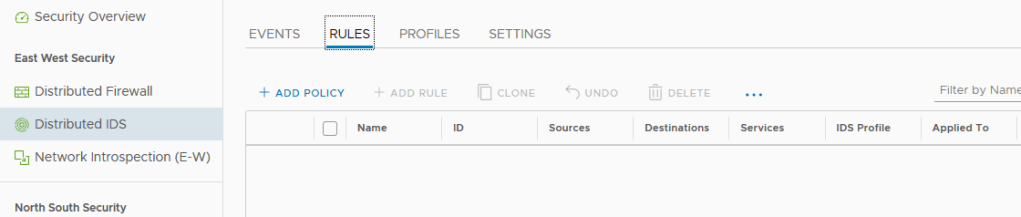
Maybe that’s why we haven’t detected any intrusions. We have no rules. Let’s create a policy and add a rule.
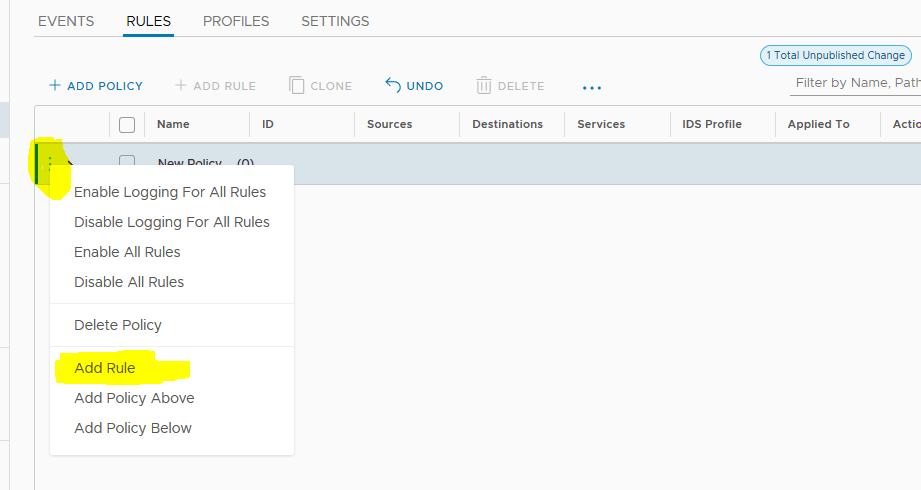
When we add this new rule, it will be appropriate to add a meaningful name to both the policy and the rule. Next we’ll identify the source, destination and service that will be examined for intrusion activity. But what level of intrusion vulnerability types will we examine? That is selected through the IDS Profile.

We have the choice to select a Default Profile or create a Profile. The Default checks for all critical CVE entries. If we create a custom IDS Profile, we can examine over 10,000 vulnerabilities if we select all four severities. Each level of severity has a collection of signatures. We have the ability to exclude signatures that do not apply to our environment.

Finally, we have the ability to automatically update vulnerability signatures or manually update (with Internet connectivity available).
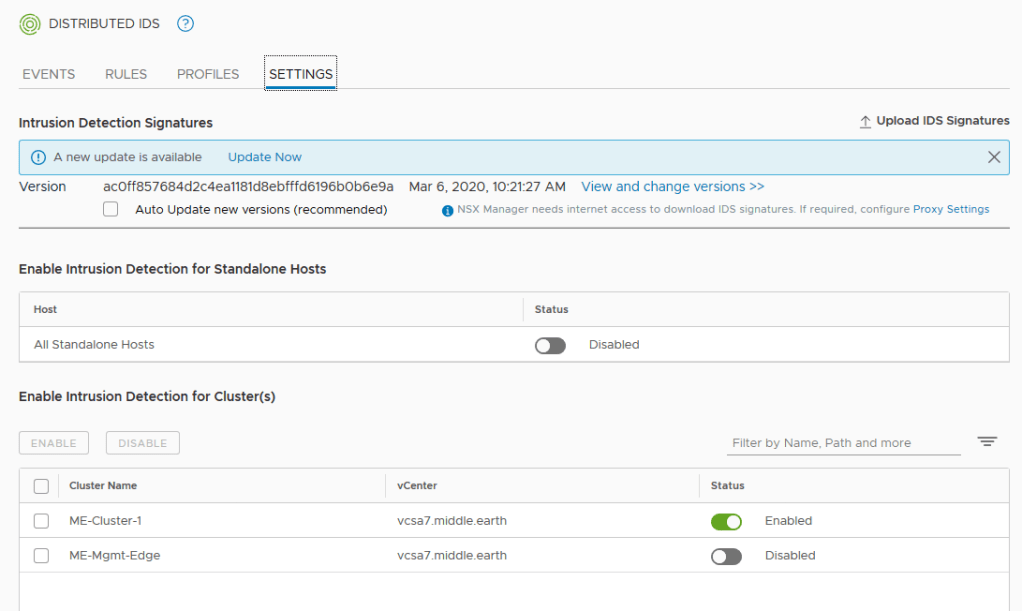

Should Internet access be unavailable, an IDS Signatures file (.zip format) can be uploaded off-line to provide more current signatures.
That’s all for this blog entry. This is a big upgrade. Future posts will touch on vSphere vDS support and other new features. My fingers are not used to this much typing in one sitting. Stay tuned. Also please check my YouTube channel (https://youtube.com/c/vgandalf). Thanks for being here!!
